In 1990, India was a closed economy with a US$ 60 billion market cap. By October 2026, successive governments across 36 years have enabled a 70x market cap surge to US$ 4T+ and a 12x GDP surge to US$ 4.2T. Key reforms were started by one government and completed by another — proof that India's capital growth is an enduring relay.
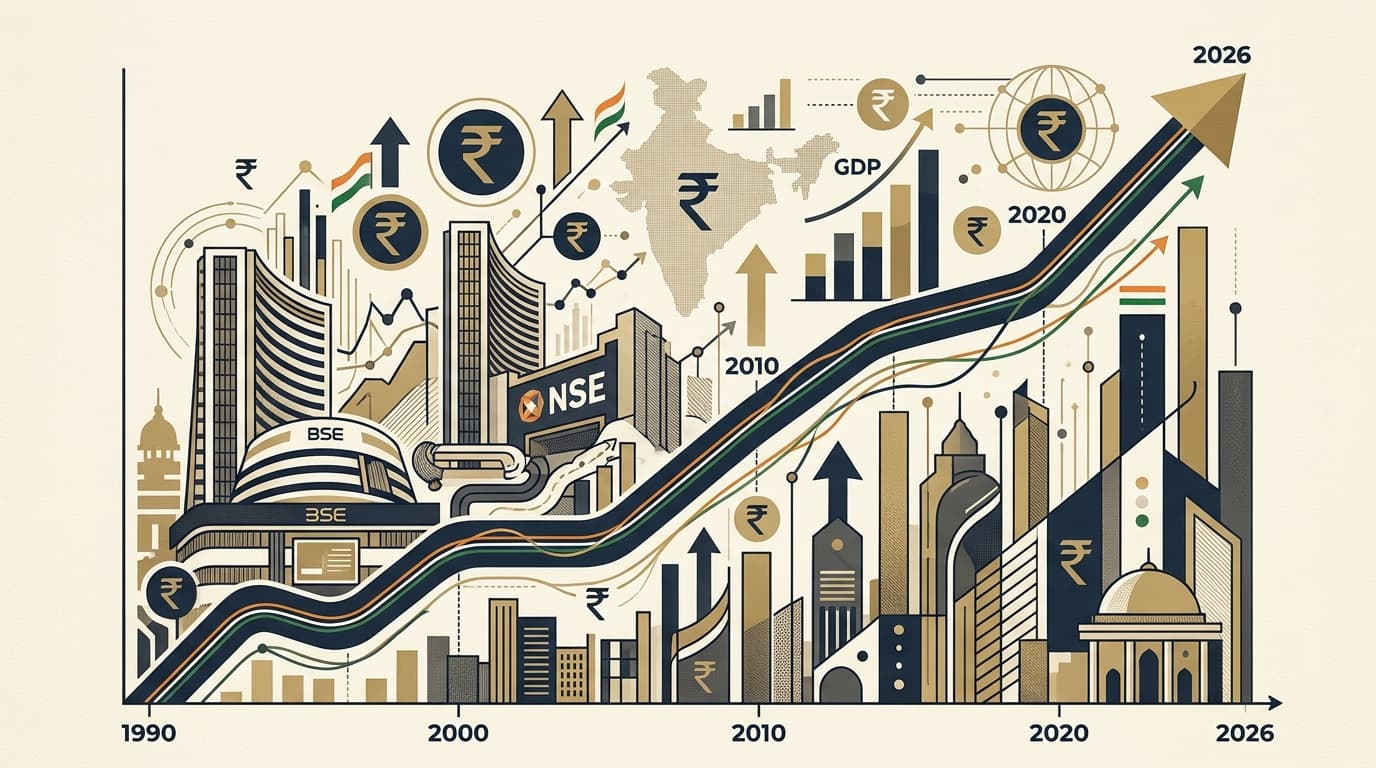
In 1990, India was a closed and insular economy. Public market capitalization stood at US$ 60 billion and GDP was US$ 350 billion. By October 2026, successive governments have driven market capitalization to surge over 70 times to US$ 4 trillion, alongside a 12x surge in GDP to US$ 4.2 trillion.
The BSE Sensex has grown nearly 74x in INR (from ~1,000 in July 1990 to ~74,400 in October 2026, compounding at ~12.6% annually). Even after an 80% currency depreciation against the US Dollar, it represents a 14x gain in dollar terms (~7.5% per annum). Governments across party lines — Congress, BJP, single-party or coalition — have each sustained this growth.
The common thread across 36 years is continuity of policy direction, not any single government. Reform enabled growth, alongside global liquidity, the IT-services boom, demographics and rising domestic savings.
Gratitude to each of them in creating a thriving formal economy, relevant capacity building, systems-processes and employment opportunities. Regards, Ram
Four Reforms Spanning Successive Governments
Key structural milestones were initiated under one administration and completed under another:
- Market Plumbing: Statutory SEBI (1992, Rao) → Screen-based NSE (1994) → Depositories & Demat (1996) → T+1 rolling settlement (2023, Modi).
- Goods & Services Tax (GST): Empowered Committee (2000, Vajpayee) → National Roadmap (2006, Singh) → Constitution Bill (2011) → Nationwide rollout (2017).
- PSU Disinvestment: Initial stake sales (1991) → Disinvestment Ministry (1999) → Coal India IPO (2010) → LIC listing (2022).
- Digital Infrastructure: NPCI incorporated (2008) → Aadhaar launched (2010) → UPI rollout (2016) → 10B+ monthly transactions (2023).
The 36-Year Reform Scorecard
| Regime / Alliance | Lead Party | Total Duration | BSE SENSEX Shift (Approx.) | Key Structural Contribution |
|---|---|---|---|---|
| --- | --- | --- | --- | --- |
| Narasimha Rao & Manmohan / UPA | Congress (INC) | 179 Months | ~1,000 → 3,800 (1990s) 5,000 → 24,000 (2000s) | LPG Reforms, Statutory SEBI, NSE Creation, Telecom Deregulation, Global Capital Integration |
| Vajpayee & Modi / NDA | BJP | 215 Months | 3,800 → 5,000 (Vajpayee) 24,000 → 74,000+ (Modi) | Disinvestment, Golden Quadrilateral, GST Rollout, IBC, UPI Rails, Corporate Tax Cuts, PLI |
| United Front / Others | Third Front | 38 Months | Maintained steady momentum | 1997 Dream Budget, early market deregulation, infrastructure financing framework |
Summary: Bipartisan consensus on policy direction enabled India's public markets to scale from $60 billion to over $4 trillion across 36 years, proving that structural reform transcends political cycles.
Available Documents & Guides
Reform is a Relay: India’s Capital Markets, 1990–2026 (PDF Edition)
Complete 2-slide presentation deck with 36-year reform relay pillars, growth metrics & bipartisan scorecard · PDF (502 KB)
[1] Approximate figures. BSE Sensex: ~1,000 (Jul 1990) → ~74,400 (16 Oct 2026); price index of 30 leading stocks, excluding dividends. US$ basis: ~₹17.5 → ~₹95 per US$. Nifty 50 shows a corresponding trend. Idea courtesy: Shri Ajit Dayal, Quantum Investment.
Free to share with attribution.